In addition to potential cash revenue from the sale of ACCUs, some ERF projects (particularly those involving sequestration) are likely to bring a number of co-benefits to the farm enterprise. While some co-benefits could potentially be monetised, many have intangible but nonetheless important value. The extent to which co-benefits can be quantified will depend on the particular farm enterprise. Some also accrue off-farm to the wider community. Co-benefits that have been identified in a number of projects include:
-
enhancing water quality in catchments
-
providing protection for stock (through trees providing shade and windbreaks)
-
improving biodiversity, for example by providing habitat for birds and other wildlife
-
alleviating dryland salinity through watertable effects
-
improving soils (including by increasing soil organic carbon stocks and so improving water-holding capacity)
-
providing a noise buffer for the farm
-
improving the broad amenity and aesthetics of the local environment.
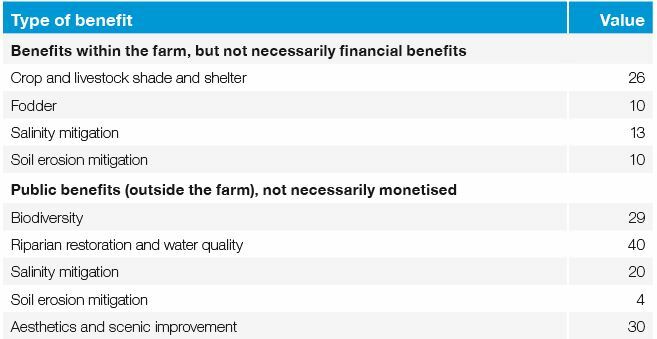
Table 8.7 sets out illustrative values for co-benefits that arise from plantation projects. The figures are derived from a comprehensive literature review looking at the benefits of plantation activities (See White L, Pearce D and de Fegely R (2013), Policy options and strategies for renewed plantation investment: Stage 2 report, Forest and Wood Products Australia.)
The benefits are divided into two types: those that occur on the farm and those that accrue outside the farm.
These benefits are indicative only: they do not necessarily apply to every farm in every circumstance. What is interesting is how they compare with potential revenue from ACCUs for different price assumptions. At low ACCU prices, co-benefits are a significant proportion of total benefits.
| Table 8.7: Potential co-benefits for generic plantation projects (A$/hectare/year) |
|
|
The relative importance of co-benefits in a CFI project depends very much on the price of ACCUs. Figure 8.4 illustrates the relative importance of co-benefits for different ACCU prices. The results in this chart assume the abatement profile from Kyogle, NSW, as shown in Table 8.2.
Figure 8.4: Relative importance of ACCU revenue and co-benefits (per hectare) |
|
|
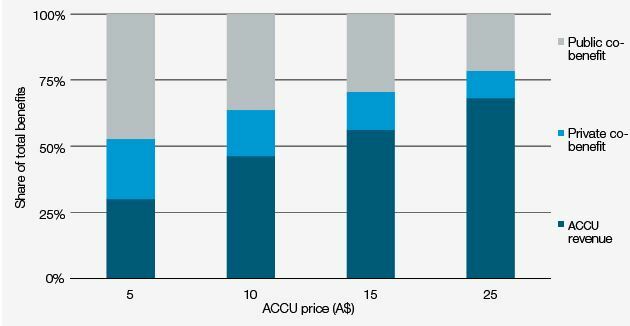
Note: Based on sequestration in Kyogle, NSW. Data source: CIE estimates based on data contained in Tables 8.2, 8.3 and 8.7. Where ACCU prices are low, the co-benefits are a major component of potential project benefits.
Explore the full Workshop Manual: The business case for carbon farming: improving your farm’s sustainability (January 2021)
Read the report
RESEARCH REPORTS
1. Introduction: background to the business case
This chapter lays out the basic background and groundwork of the manual
RESEARCH REPORTS
1.2 Being clear about the reasons for participating
Introduction: background to the business case
RESEARCH REPORTS
1.4 Working through the business case for carbon farming
Introduction: background to the business case
RESEARCH REPORTS
1.5 Factors determining project economics
Introduction: background to the business case
RESEARCH REPORTS
1.8 Important features of the business case
Introduction: background to the business case
RESEARCH REPORTS
2. How carbon is farmed under the ERF
This chapter considers in detail the activities that constitute carbon farming
RESEARCH REPORTS
2.5 Carbon farming under the Emissions Reduction Fund
How carbon is farmed under the ERF
RESEARCH REPORTS
3. The policy context and the price of ACCUs
This chapter takes a broad look at the policy context for carbon farming